During the first half of 2023, shrimp buyers and sellers have been suffering from low prices on one hand, and increasing costs on the other.
In this blog, I will present the latest available trade data for each major supplier and market and highlight the most interesting developments. Digesting this data will help us better understand the impact of the low prices and high costs on trade flows and how the market may develop over the next few months. I will publish the blog in two parts. In this first part, I will report on export data. The second part will deal with import data.
![]()
In 2023, the Shrimp Blog is supported by: Inve Aquaculture, Taprobane Seafoods, DSM Animal Nutrition, Zeigler Nutrition, aquaconnect, Bioiberica, Megasupply, American Penaeid, and Omarsa.

ECUADOR RECORDS 19% YEAR-ON-YEAR GROWTH FROM JANUARY TO MAY 2023
Export volume
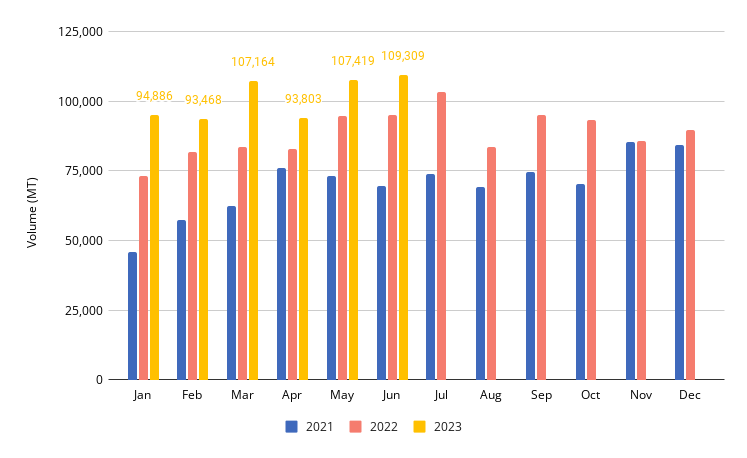
Figure 1. Ecuador’s shrimp exports from 2021-2023
Source: Cámara Nacional de Acuacultura
Ecuador’s total export volume from January to June 2023 reached 606,048 MT, 19% more than in 2022. While the year-on-year growth rate reached still 24% in the first quarter of 2023, in the second quarter year-on-year growth slowed down. Monthly year-on-year growth rates of 13% in April, 13% in May and 15% in June suggest that in the current market situation Ecuador’s exporters cannot maintain the same upward growth trend as they realized in the first half of 2022. Nevertheless, the year-total growth rate of 19% is of course still significant.
Export value
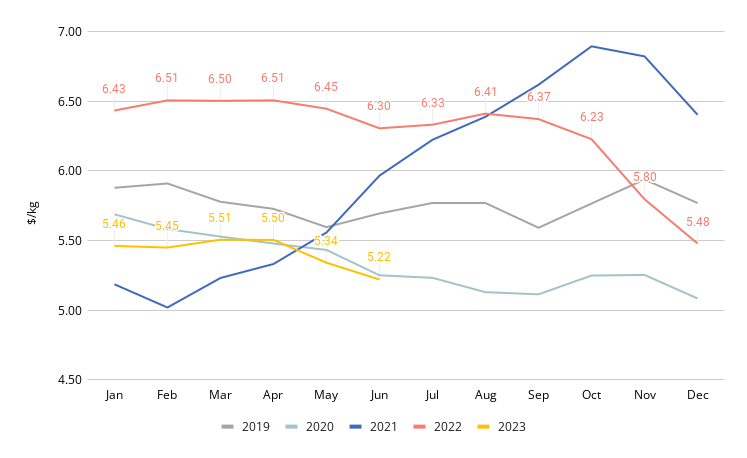
Figure 2. Average value per kg of exported shrimp from Ecuador
Source: Cámara Nacional de Acuacultura
Ecuador’s export value over the first six months of 2023 reached $3.3bn, the same amount as in 2023, but average export prices dropped around $1/kg (Figure 2). Prices did not fall as low as in 2021. In 2021, Ecuador was confronted with the collapse of demand from China due to COVID-19 restrictions. After a steady drop throughout 2020, the average price per kg quickly recovered from February 2021 onwards and peaked at almost $7/kg in October 2021. Prices began to fall sharply from September 2022 before stabilizing at a low level in 2023. Unfortunately, with the current market situation, it’s unlikely that we’ll see a similar recovery as in 2021 anytime soon.

Export markets
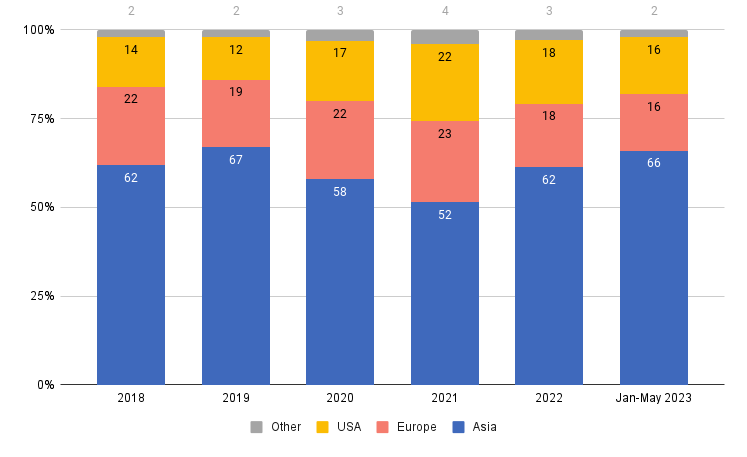
Figure 3. Market shares of Ecuador’s shrimp markets
Source: Cámara Nacional de Acuacultura
In Q1 2023, Ecuador recorded the strongest year-year growth rates in China. However, in Q2, growth rates to Europe and the US grew stronger while the growth rates to China slowed down. The volume exported to China increased between January and June by 40% year-on-year to 375,591 MT. China today accounts for 62% of Ecuador’s exports, up from 53% in 2022. Exports to the rest of Asia dropped by 32% to 22,327 MT. This was mainly accounted for by a considerable drop in exports to Vietnam and South Korea, which dropped by 52% and 48%, respectively.
European imports from Ecuador started relatively weak in Q1 2023 but increased considerably in the later part of Q2. By the end of Q2 exports to Europe were 1% ahead of 2022 and reached 98,130 MT. Exports to France, Italy, and Spain declined, with drops of 18%, 1%, and 12%, respectively. On the contrary, Belgium and the Netherlands drastically increased their imports year-on-year by 93% and 52%. Although still much smaller than the Southern European countries, the Northern European market is growing for Ecuador as part of a shift in sourcing from Asia to Latin America. Russia also immensely increased its imports from Ecuador, by 83% year-on-year. Russia is now Ecuador’s fourth largest European market.
Exports to the US dropped by 3% over the first six months of 2023 to 96,068 MT. The drop in exports to the US mainly happened in Q1 2023 while in Q2 Ecuador recorded year-on-year growth. I will dive deeper into supplies in the US in the second part of this blog on imports. One thing that will become clear is that not all Ecuador’s suppliers reduced their export volumes to the US.
Outlook
Some industry sources in Ecuador argue that over the next few months, due to low prices, slow demand, high production costs, and other challenges, such as the consequences of El Niño, Ecuador, too, will see its export performance weaken as the major players will have to adjust their growth ambitions, at least for the short term.
Others warn that all major players in Ecuador are still in growth mode and that there are few signs that anyone is ready to slow down their stocking activities. One of the reasons for this is the recent investments that were made in new processing capacities and the need to run these facilities at capacity. The major impact of high costs and low prices would be consolidation, where the larger companies will take over the farms of those who cannot deal with the current costs and prices. Some insiders are betting on producers in other parts of the world reducing their production sooner than their Ecuadorian competitors, which will allow Ecuador to continue to grow.
We’ll have to watch closely what will happen over the next couple of months to better understand the consequences of Ecuador’s growth for the shrimp industry in other parts of the world.

INDIA’S EXPORTS ONLY STARTED TO DROP YEAR-ON-YEAR IN APRIL AND MAY, WITH A STRONGER DROP EXPECTED IN JUNE AND JULY
Export volume
The drop in export volume from India is less severe than many may have expected. With around 258,000 MT, India’s total shrimp export volume between January and May 2023 is at a similar level as in 2022.
With 148,267 MT in the first quarter of 2023, India recorded a 12% higher export volume than the first quarter of 2022. However, with a drop of 14% in April and 8% in May, the export volume fell below the monthly volume in 2022. But the drop is nowhere near the 20-30% drop in production, as is suggested by broodstock import data and which one may expect based on the production reports coming from the Indian shrimp industry. This suggests that India’s first crop was larger than expected or that Indian exporters in April and May have largely been selling stocks from last year.
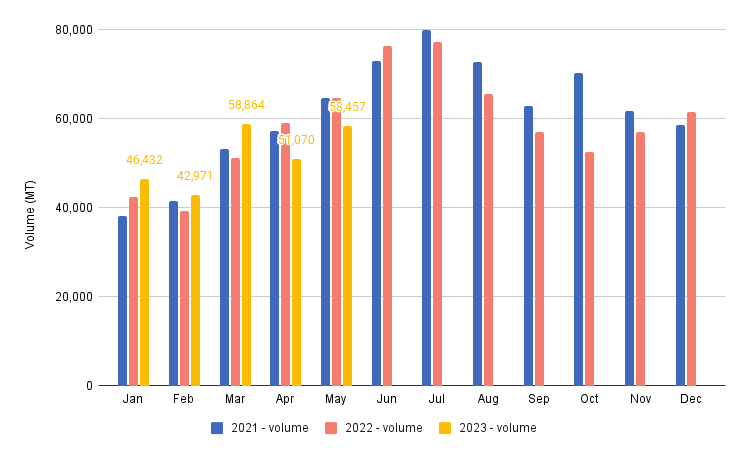
Figure 4. India’s monthly shrimp export volume from 2021-2023
Source: Ministry of Commerce
Export value
India’s shrimp export value is different. The year total export value from January-May is $1.8bn, down by 13% year-on-year. The export value fell the most in April and May, when it was down by 23% and 22% year-on-year, respectively. At the beginning of this year, the average export prices of raw L. vannamei were almost $1.5/kg below the level of 2022 (Figure 5). In April and May, the gap closed to around $1/kg. But combined with increased production costs, it's clear that in India, too, farmers and vertically integrated producers have been losing money.
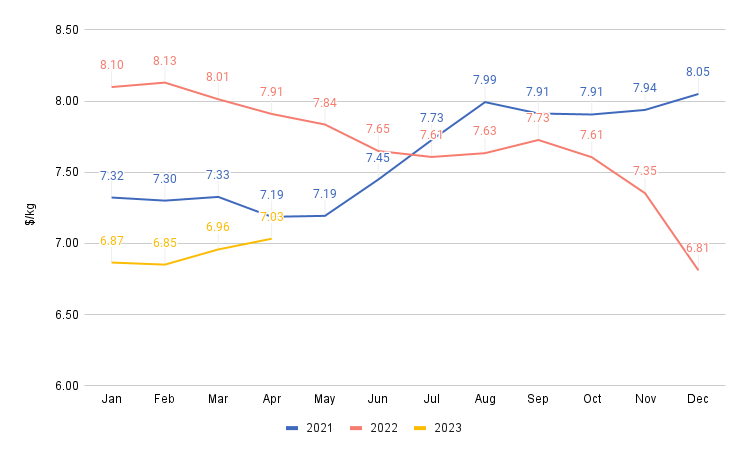
Figure 5. Average prices of India’s raw L. vannamei exports from 2021-2023
Source: Ministry of Commerce

Export products and markets
The export trend in India varies from product to product (Table 1). Exports of raw L. vannamei—by far India’s largest export product—dropped much less steeply than e.g. value-added exports. Raw L. vannamei exports only decreased year-on-year since April, and the year total from January to May is still up by 4%. In terms of export markets, with a drop of 8% of the export volume to the US, its share of India’s exports dropped to 44%. Exports to China increased a couple of hundred MT, but China’s share of India’s exports of this product dropped by 1%. Exports to Europe and other Asian markets grew by 11% and 17%, respectively. In Europe, growth can be witnessed in most countries. In Asia, the growth was largely accounted for by exports to Vietnam.
| Jan | Feb | Mar | Apr | May | Jan-May | Jan-May (MT) | |
|---|---|---|---|---|---|---|---|
| Raw L. vannamei | 16% | 21% | 23% | -12% | -10% | 4% | 201,242 |
| Raw P. monodon | 89% | 106% | 336% | 178% | 124% | 157% | 10,586 |
| Value-added | -15% | -27% | -27% | -27% | -23% | -26% | 21,702 |
| Wild shrimp | -15% | -21% | -14% | -36% | -16% | -20% | 24,262 |
| Total | 10% | 9% | 15% | -14% | -10% | 0% | 257,793 |
Value-added (mainly cooked) products accounted for the biggest drop in India’s exports. Exports dropped below the volumes of 2022 every month. Between January-May, the year total export volume decreased by 26%—a signal of declining demand from US retail. After a 33% drop in imports by the US, its share of India’s exports fell from 84% to 77%. A 33% increase in exports to Europe partly compensated for the drop in exports to the US, and Europe increased its share of India’s value-added exports to 8%.
Exports of P. monodon have risen steeply in the first five months of 2023 and reached 10,586 MT compared to only 4,000 MT over the same period in 2022—an increase of 157%. According to sources in India, the volume of P. monodon will continue to grow significantly over the next couple of months, with peak harvests expected between August and early October. Broodstock import and production numbers of Vaishnavi Aquatech and Unima support this. Interestingly, sources mention that while last year India’s exporters sold P. monodon at similar prices as its Bangladeshi competitors, this year, it seems that Indian exporters have managed to maintain a higher price level.
Regarding the markets for P. monodon, last year, the European markets absorbed the largest part of India’s growth with a 30% share of exports. This year, European imports dropped by 34% year-on-year, and Europe’s share dropped to 20%. Exports to China grew by 200%, and the share of the Chinese market is now 17%. The biggest market remains the rest of Asia, which increased its share from 39% in 2022 to 46% in 2023. In absolute terms, exports to the rest of Asia almost tripled to 4,826 MT, mainly accounted for by Japan and Vietnam. The US’s market share of India’s P. monodon exports dropped from 20% in 2022 to 14% in 2023—a drop of 31% in absolute terms.
Outlook
It’s always difficult to understand what’s going on in India. Reports from large vertically integrated producers in Andhra Pradesh may differ from reports from farmers or smaller exporters in other states where the shrimp industry operates in isolated clusters with their own dynamics. But, while there’s still discrepancy today, qualitative reports from the field and quantitative data from public sources are getting more aligned each month. Existing stocks from last year’s crop should have been shipped, which creates less uncertainty about how to interpret the export data. Broodstock import numbers do suggest that a decrease in production of at least 20%, possibly even 30%, for the first and second crop of 2023 is realistic.
I don’t doubt that India’s shrimp exports will decline further over the next few months. But whether the drop is as deep as some are expecting remains uncertain. Farm gate prices have stabilized and Indian farmers will continue production at some level to maintain their livelihoods, and Indian processors and feed companies will support them because they also need to keep their businesses going. How big the crisis becomes will depend in part on whether Ecuador’s production will stabilize or continue to grow further to compete for the market share of Indian producers in the US.
I will be keeping a close eye on how overall exports develop, specifically exports of cooked and breaded shrimp and P. monodon shrimp in India.

INDONESIA’S EXPORTS IN Q1 AND Q2 2023 WERE DOWN BY 19% YEAR-ON-YEAR
Export volume
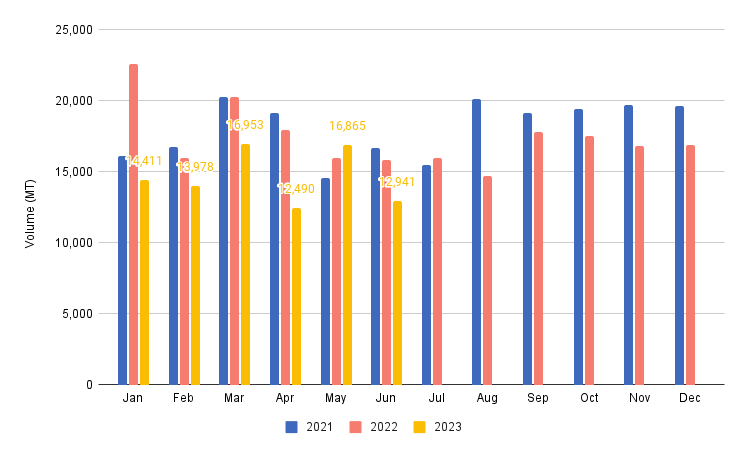
Figure 6. Indonesia’s L. vannamei exports from 2021-2023
Source: BKIPM, KKP
The most up-to-date data for Indonesia’s shrimp exports comes from the quality department (BKIPM) of the Ministry of Marine Affairs and Fisheries (KKP). BKIPM data represents products tested for exports. Whether the product has already been shipped or is still in local cold stores is unknown. BKIPM only reports data for L. vannamei, not for wild-caught and P. monodon shrimp.
According to BKIPM, Indonesia’s total L. vannamei exports in the first two quarters of 2023 reached only 87,638 MT, down by 19% compared to 2022 and at the lowest volume since 2019, when exports reached 76,596 MT. Exports for Q1 2023 faced a stronger fall (-23%) than exports over Q2 2023 (-15%). May 2023, the month after Ramadhan, even showed year-on-year growth (5%), but April and June were down 30% and 18%.
Export value
According to another data source within the KKP, Indonesia’s total shrimp export value between January and May 2023 reached $710m. The average value per kg, after a gradual drop from a peak of almost $10/kg in April 2022 to around $8/kg by the end of 2022, stabilized at around $8/kg. These numbers combine the value of raw frozen and value-added exports, so just provide an indication of the overall trend.
Export markets
Indonesia is highly dependent on exports to the US—68% in 2022, to be exact—and its exports to the US have fallen more sharply than exports to other countries. According to the National Oceanic and Atmospheric Administration, Indonesia’s exports to the US declined by 41% year-on-year over the first five months of 2023. The drop was the biggest for exports of shell-on products (-51%) but was substantial across the board. Peeled shrimp exports were the least affected, with a decline of 24%. Only Vietnam seems to be doing (much) worse, with a drop of 58%.

VIETNAM’S EXPORT VOLUME IN Q1 AND Q2 2023 DOWN BY AROUND 30% YEAR-ON-YEAR
Export volume
While the trade data of Ecuador and India is easy to obtain, it’s a bit more difficult in the case of Vietnam. The Vietnam Association of Seafood Exporters and Producers (VASEP) publishes quarterly reports where HS codes and species are separated, but these publications only include values, not volumes. Trade values are hard to interpret as a change in export value can be explained by a change in volume, prices, or both. However, there are different ways to work around this.
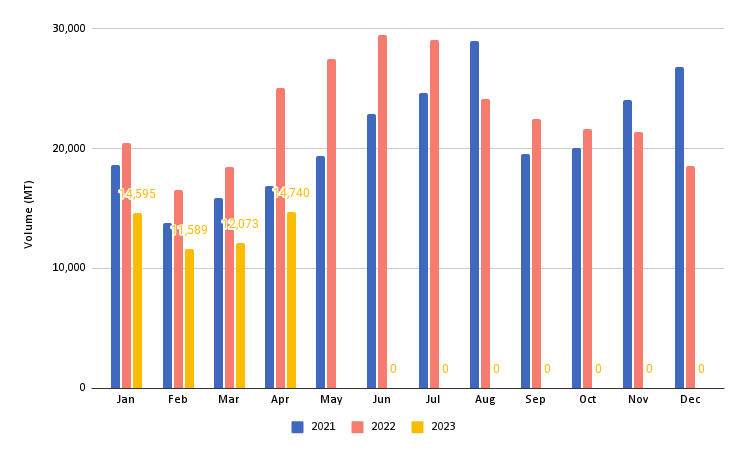
Figure 7. Shrimp imports from Vietnam by Vietnam’s main trading partners in 2021-2023
Source: ITC Trade Map mirror data
To estimate Vietnam’s export volumes, we can look at imports from Vietnam reported by its main trading partners. Although this data reflects the volume of shrimp imported into the markets at a certain time and not the product exported from Vietnam at a particular moment, looking at this data over time nevertheless provides a good view of the trend.
Figure 7 shows that, when looking at the imports of China, Europe, Japan, South Korea, the UK and the US, this year’s volumes from Vietnam have been dramatic. The year total in April (the last month for which data is available from all these markets), with 52,997 MT, was behind 2022 by 34% and even 7% below the lowest point previously reached in 2019.
Undercurrent News, which has access to a local data source in Vietnam whose data is disclosed up to June 2023, reports that Vietnam’s export performance improved year-on-year in May when exports of L. vannamei to all markets combined reached 27,504 MT, up by 11% year-on-year, and 36% higher than in April. Exports in June were around the same level as in May.
According to the same source, due to the recovery of exports in May and June, total L. vannamei exports to Vietnam’s main export markets in 2023 are reported to be down year-on-year by around 9% only. Similarly, Vietnam’s P. monodon exports would be down by 9% year-on-year. P. monodon is reported to only account for over 10% of the total export volume.

Export value
According to VASEP, Vietnam’s shrimp export value over the first half of 2023 reached $1.6bn, down by 31% from 2022. The average price per kg to the US and Europe, in particular, dropped sharply, while the price levels of exports to the Asian markets remained relatively stable.
Export markets
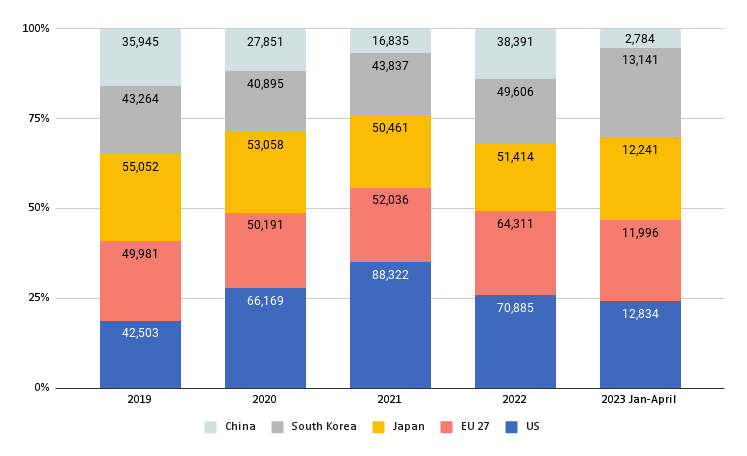
Figure 8. Vietnam’s markets’ relative shares of the country’s shrimp exports from 2019 until 2023
Source: ITC Trade Map mirror data
From January to May, the US’s imports from Vietnam dropped year-on-year by 41% to 17,568 MT, the lowest level since 2019, diminishing Vietnam’s growth in the US market over the past three years. While exports of raw shell-on and raw peeled shrimp to the US dropped by 49% and 53%, respectively, exports of cooked and breaded shrimp dropped by 43% and 27%, respectively.
The same happened with Vietnam’s exports to Europe, which dropped by 40% year-on-year from January to April to 11,996 MT in 2023, the lowest level since 2020. In Europe, the drop is mainly accounted for by the reduction in exports of raw frozen shrimp, which reached only 6,286 MT this year, a decline of 47%. Cooked and further value-added products now account for 48% of Vietnam’s total exports to Europe.
The situation in China is even worse for Vietnam’s exporters. Exports over the first five months of 2023 declined by 70% year-on-year. Vietnam’s exports to the rest of Asia seem to be doing slightly better. Exports to Japan between January and April dropped by 19% year-on-year, while exports to South Korea only dropped by 9% year-on-year between January and May.
Outlook for Vietnam and Indonesia
Vietnam’s and Indonesia’s exports have been more heavily affected by the demand and supply situation in the shrimp industry than Ecuador and India.
Both countries have higher production costs than Ecuador and India and their exports have dropped significantly year-on-year. The outlook for both countries is not very optimistic. Especially for Vietnam, the fact that the recovery of exports in May and June comes on par with a steep drop in farm gate prices makes me wonder whether there is some light at the end of the tunnel for Vietnamese producers and processors any time soon.
While both countries had their competitive edge also in producing cooked and further value-added products, Ecuador and India are investing heavily in this segment in order to diversify their options and it is likely that Vietnam and Indonesian exporters will soon experience increased competition from both countries for these market segments.

CONCLUSION
That shrimp farmers and processors worldwide are losing money is obvious amidst increasing costs and low prices. How the situation will evolve depends on whether shrimp producers in Latin America and Asia will adjust their growth ambitions and on whether consumers’ appetite for shrimp will increase amidst declining consumer purchasing power in the major shrimp markets.
Although we may see a slight recovery of prices over the summer and toward the end of the year for the holiday season, it’s unlikely that prices will recover to similar levels as before the drastic drop that we have seen in Q3 and Q4 2022. The importers holding overpriced stocks are expected to have taken their losses and have slowly replaced these overpriced stocks with cheaper products at current price levels. This may result in more opportunistic behaviour over the next couple of months, although most of the importers are also still concerned about how their sales will evolve over the rest of the year due to uncertainty about how consumer purchasing power will develop.
How strongly prices will recover depends not only on demand but also on how supply volumes evolve towards the end of the year. If producers in especially Ecuador and India will not slow down, it’s very well possible that the low prices will not improve much at all, allowing processors and importers to build cheap inventories but putting the profitability of farming operations at risk.
In the next blog, I will report on the market situation in China, Europe, the US, and other markets in more detail.

| Nguồn: Theo Shrimpinsights Kính thưa quý độc giả, Thủy Sản 247 hiện đang là đối tác truyền thông uy tín của nhiều đơn vị báo chí, truyền thông, triễn lãm, hội chợ chuyên ngành thủy sản trên toàn cầu. Với xứ mệnh kết nối truyền thông thủy sản toàn cầu, chúng tôi sẽ nỗ lực mang đến quý độc giả nhưng thông tin hữu ích, kịp thời và uy tín. Để người nuôi tôm, cá và doanh nghiệp thuận tiện cho việc phát triển nuôi trồng và kinh doanh. Quý bạn đọc có thể tham khảo hệ sinh thái Thủy Sản 247 bằng cách bấm vào đây để biết thêm chi tiết. BQT Thủy Sản 247 Group. Vui lòng ghi rõ nguồn thuysan247.com khi sao chép bài viết này. Liên hệ cung cấp thông tin và gửi tin bài cộng tác về email [email protected]. Nhấn nút "quan tâm" nếu bạn muốn nhận thông tin cập nhật từ chúng tôi trên Zalo. |


Bình luận bài viết