
Argentina, Brazil, Chile, Colombia, Ecuador and Peru - and exports to more than 23 countries.

Alicorp S.A.A. (“the Company” or “Alicorp”) (BVL: ALICORC1 and ALICORI1) announced today its unaudited financial results corresponding to the Second Quarter 2017 (Q2 17’). Financial figures are reported on a consolidated basis and are in accordance with International Financial Reporting Standards (“IFRS”) in nominal Peruvian Soles, based on the following statements, which should be read in conjunction with the Financial Statements and Notes to the Financial Statements published at the Peruvian Securities and Exchange Commission (Superintendencia del Mercado de Valores – SMV).
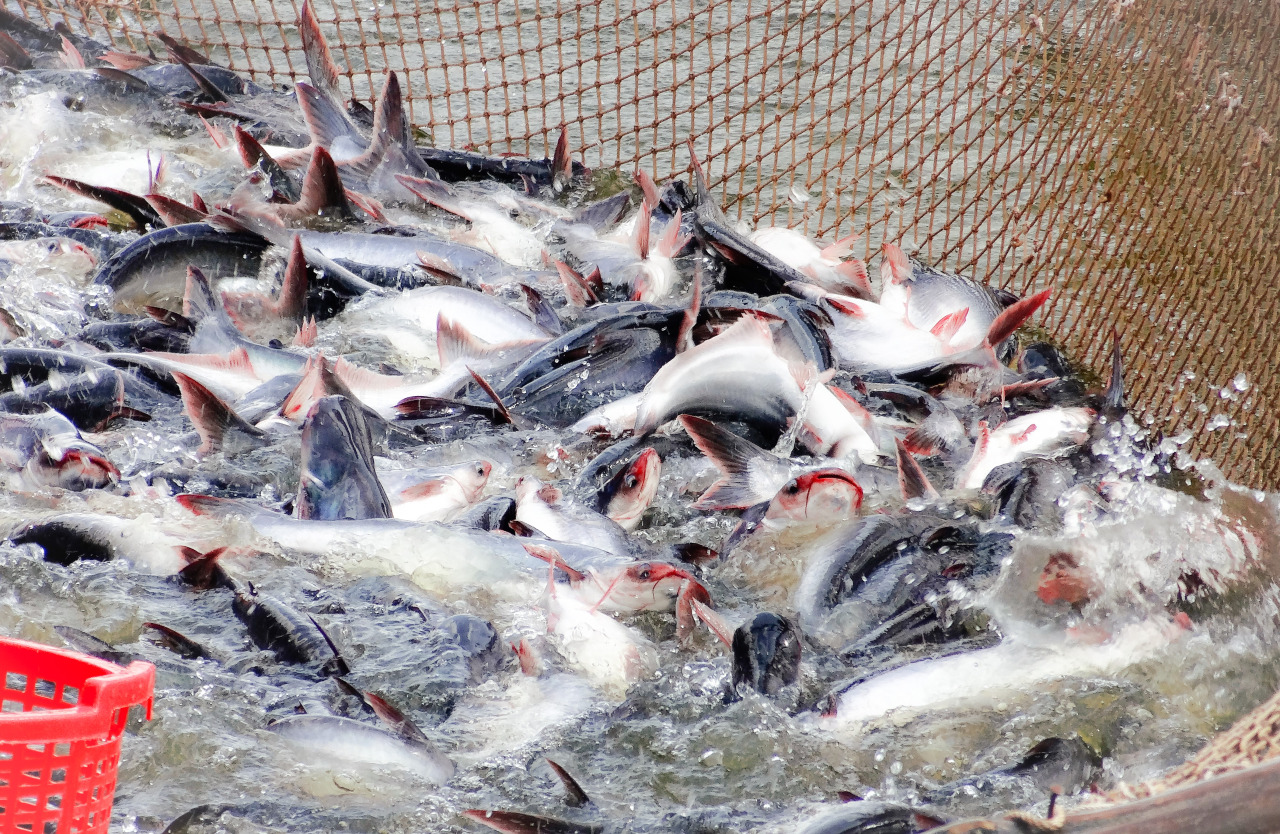
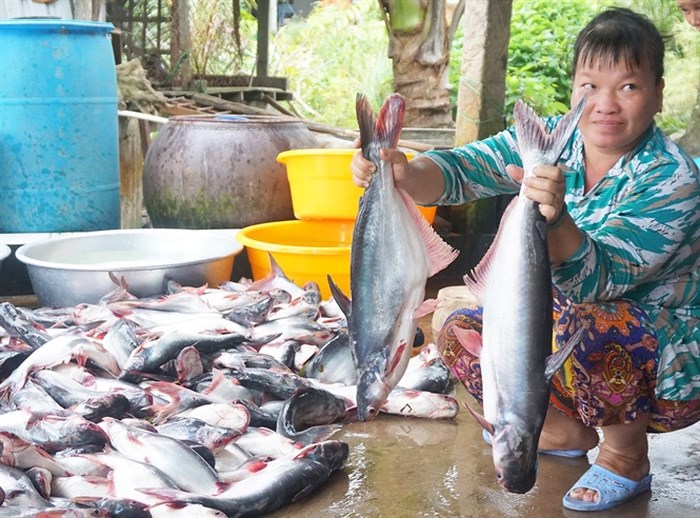
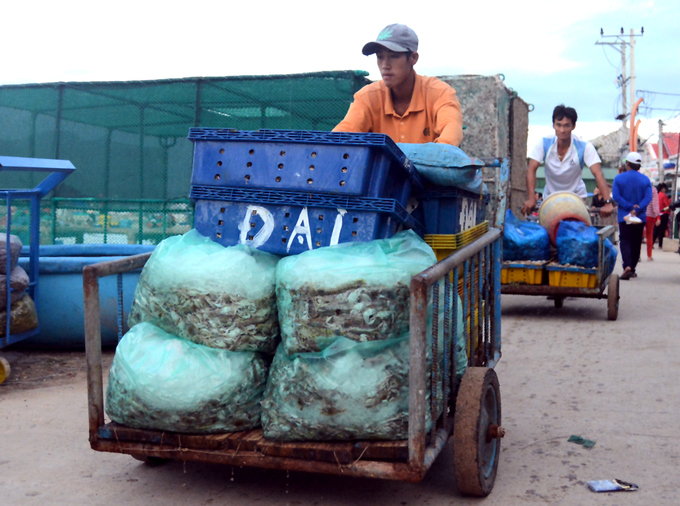
1. Consolidated Revenue amounted to S/ 1,827.4 million (+12.2% YoY), while Volume reached 481.2 thousand tons (+9.5% YoY). Increase in Revenue was mainly explained by: i) a 43.1% YoY increase in the Aquaculture business as a result of capturing a higher market share while an expansion of the Ecuador’s shrimp feed market and the Chile´s fish feed market was occurring; ii) a 8.3% YoY increase in the Consumer Goods Peru business due to the growth of the core categories; and iii) a 4.4% YoY increase in the B2B business due to higher Revenue in the Food Service platform.
2. Revenue and Volume from the Consumer Goods Peru business reached S/ 666.8 million (+8.3% YoY) and 129.0 thousand tons (+3.0% YoY) during Q2 17’. This increase was mainly explained by i) the launch of the canned tuna category which explained one third of Consumer Goods Peru´s Revenue growth, and ii) the organic growth registered by our core categories such as Laundry Detergents (+8.2% YoY), Edible Oils (+7.1% YoY), Sauces (+10.9% YoY), Softeners (78.2% YoY), and Laundry Soap (+7.9% YoY) due to the Company’s commercial strategy that resulted in an equal or a higher value share in 12 of 14 categories.
3. Regarding product innovation, during Q2 17’ the Company launched 10 products (6 in Consumer Goods Peru, 2 in Consumer Goods International, 1 in B2B and 1 in Aquaculture) The following launches can be highlighted: i) canned tuna under the “Primor” brand, launching a new category, ii) “Care blocks” for the fish feed platform, launching a new line of nutritional complements, and iii) “Casino Black”, revamping a core brand in the cookies & crackers category.
4. Gross Margin increased by 1.4 p.p. YoY (31.6% in Q2 17’ versus 30.2% in Q2 16’), while Gross Profit reached S/ 577.3 million, a 17.2% increase compared to the S/ 492.4 million of Q2 16’. The improvement was mainly explained by i) revenue management and design-to-value initiatives in the Consumer Goods Peru business, despite rising prices of raw materials, ii) savings in procurement and manufacturing as a result of our efficiencies program, iii) lower raw material prices in the Aquaculture business and iv) a higher operating contribution from Consumer Goods in Brazil.
5. EBITDA amounted to S/ 241.7 million (+24.4% YoY), and EBITDA Margin increased by 1.3 p.p. YoY (13.2% during Q2 17’ versus 11.9% in Q2 16’).
6. Consequently, Net Income totaled S/128.2 million during Q2 17’, an increase of 71.4% YoY, while Net Margin reached 7.0%, an increase of 2.4 p.p. YoY. As a result of the aforementioned profitability´s increase and Net Financial Expenses´ decrease. Thus, Earnings per Share (EPS) increased from S/ 0.087 in Q2 16’ to S/ 0.148 in Q2 17’.
7. Cash flow from Operations as of June 2017 was S/ 598.7 million, S/ 378.2 million higher than the figure generated as of June 2016. This increase was mainly explained by: i) a higher Consolidated Revenue and EBITDA generation, and ii) an efficient working capital management. Cash Flow used in Investing Operations was S/ 16.6 million, compared to S/ 44.8 million registered as of June 2016. CAPEX investments as of June 2017 were S/ 34.3 million.
8. As of June 2017, Net Debt decreased by S/ 411.8 million versus December 2016, reaching S/ 921.1 million. Total Debt was S/ 1,624.5 million as of June 2017, S/ 18.1 million higher compared to December 2016. Net Debt decreased as a result of a strong cash flow generation and a higher profitability. Net Debt-to-EBITDA ratio decreased from 1.66x as of December 2016 to 1.06x as of June 2017.
Source: http://www.aquaculturemag.com


Bình luận bài viết